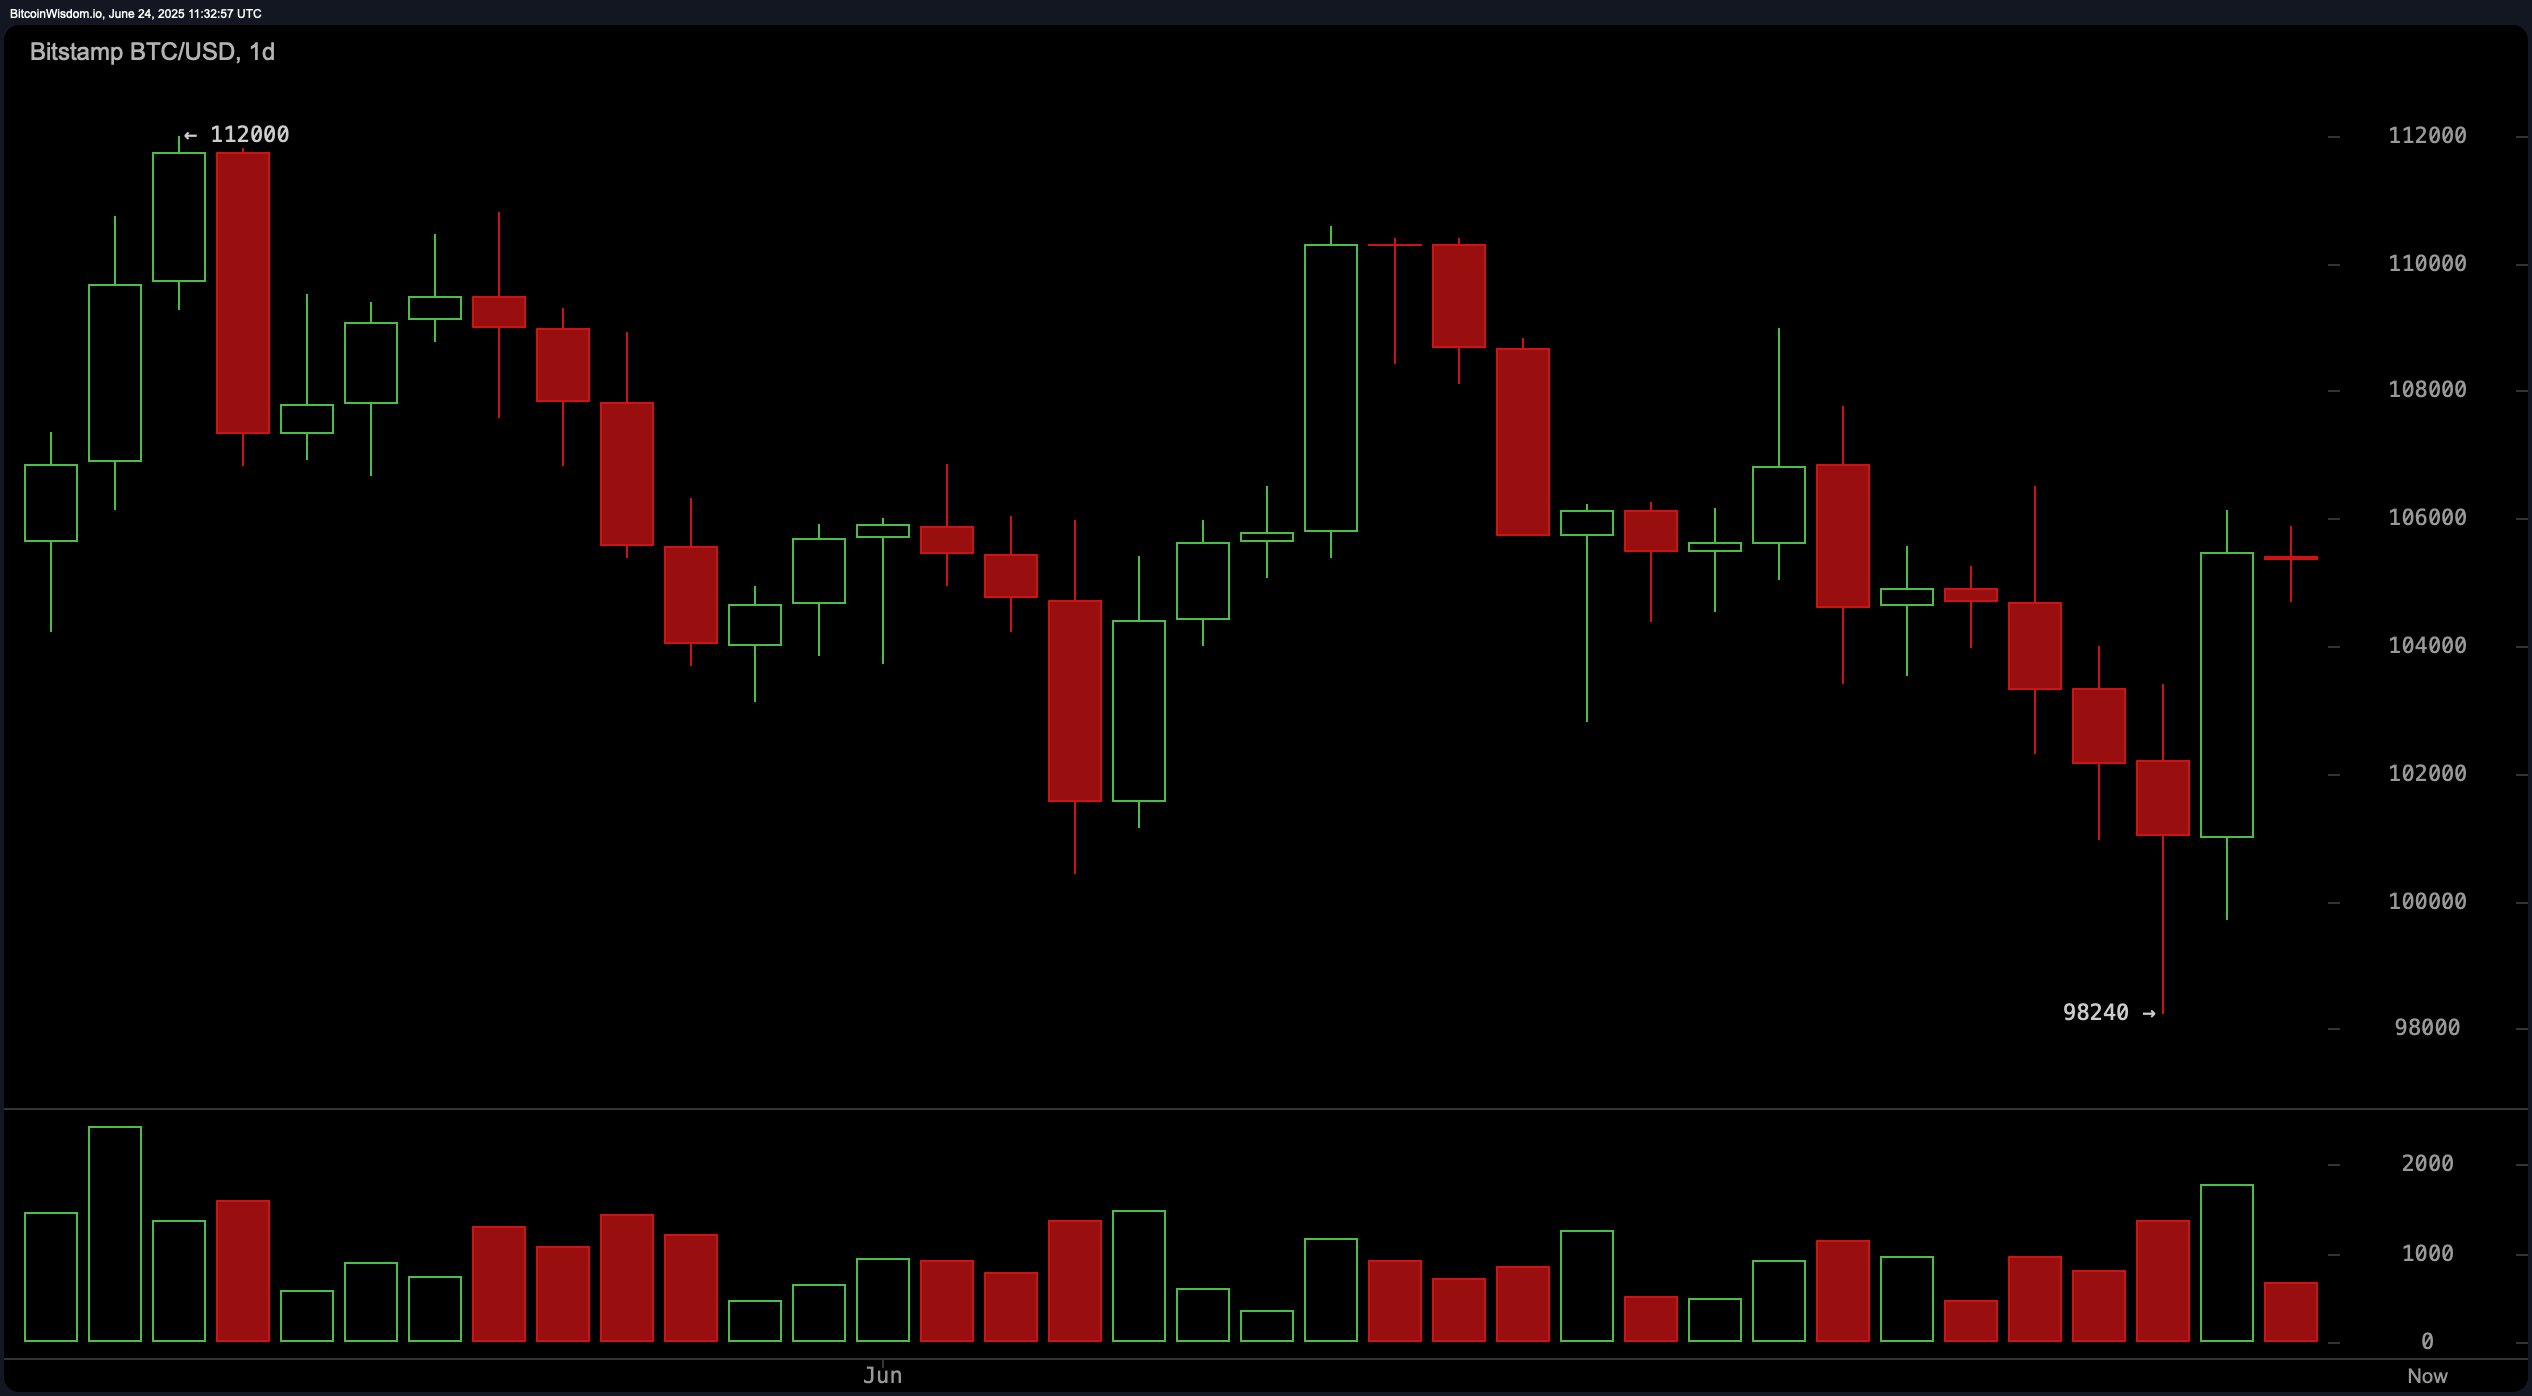
On the daily chart, bitcoin shows signs of a reversal after a pronounced mid-term downtrend from $112,000 to a recent low near $98,240. A bullish reversal candle accompanied by increased volume suggests renewed buying interest. The current support level sits firmly at $98,000, while resistance looms between $106,000 and $108,000. Maintaining a position above $104,000 is critical for sustaining this upside momentum. The daily bias remains cautiously optimistic, contingent on price action staying above this threshold.

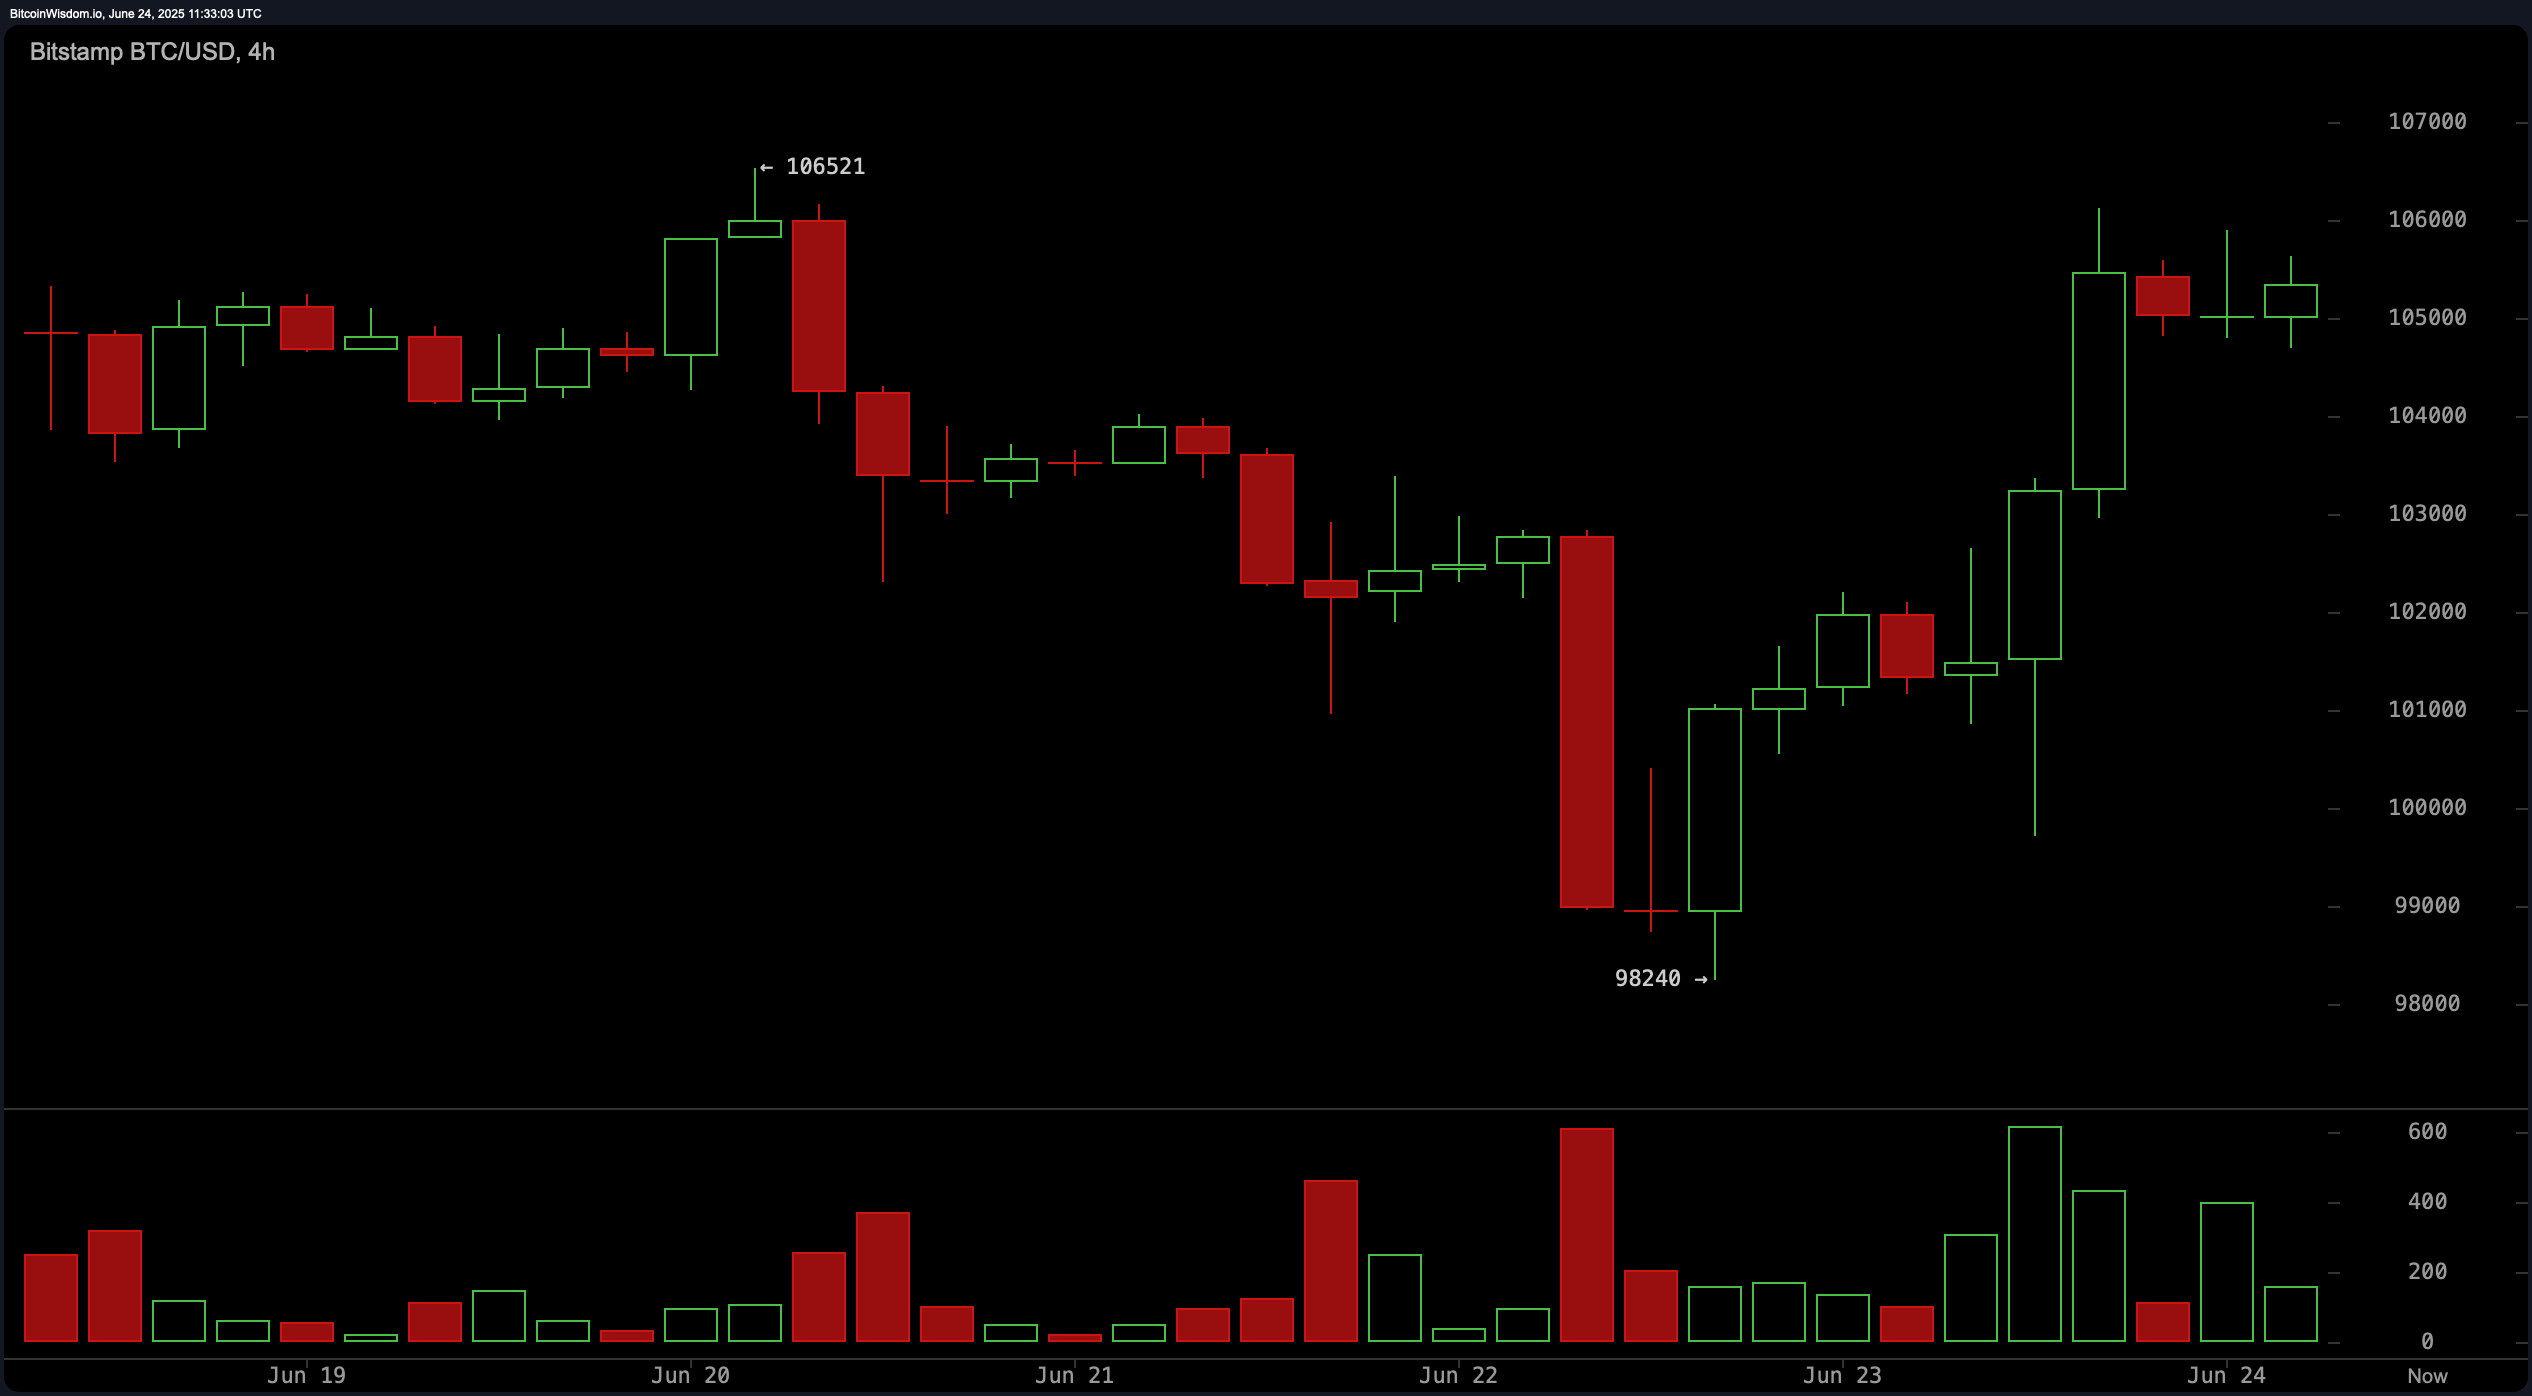
The 4-hour bitcoin chart reveals a pronounced V-shaped recovery, reinforcing the bullish short-term narrative. After bottoming out at $98,240, bitcoin surged with strength, supported by rising green volume bars and consolidation just below the $106,000 resistance. A breakout above $106,500, especially with volume confirmation, could pave the way for a move toward $108,000 or higher. This timeframe reinforces active bullish participation, suggesting upward continuation if critical resistance is cleared.

In the 1-hour chart, bitcoin displays a strong uptrend from $99,705, marked by a sequence of higher highs and higher lows. The price is consolidating between $105,000 and $106,000, potentially forming a bullish flag pattern. Although volume has tapered slightly, indicating the possibility of a minor pullback, a retracement toward the $104,500–$105,000 range may present an opportunity for long entries. The bias remains bullish, though cautious positioning is advised near resistance zones.

Post a Comment